
Q1. Draw the decision tree diagram and explain the best possible decision based on EMVs (Expected Monetary Values) On the 1st April 2023, Rajinder Saproo, an investor is in a dilemma for the investment of 10 lakh INR. He has consulted his Mumbai based friend, MukulBhai Gadhecha, an investment expert for this matter. Mr Saproo went to meet him at his office located at Prabhadevi. Mukulbhai asked him to express his feeling for the market situation in coming economic year.
Mr Saproo assumed the economic growth for the coming year in the following way.
10 % optimist for the ‘Good Economic Growth’
50 % optimist for the ‘Moderate Economic Growth’
40 % optimist for the ‘Lower Economic Growth’.
In addition to this, MuKulbhai Gadhecha carried out his analysis to derive possible payoff values considering the various investment options as per the economic situations (presented in the table given below). Figures are in INR on the investment of whole amount of 10 lakhs.
| Options | Good Economic Growth | Moderate Economic Growth | Lower Economic Growth’ |
| Mauti Suzuki Shares | 3,00,000 | 1,20,000 | 50,000 |
| TATA Motor Shares | 4,00,000 | 1,00,000 | 10,000 |
| D Mart shares | 4,50,000 | 2,30,000 | 30,000 |
If you were in place of Mukulbhai Gadhecha, What do you recommend to Mr. Saproo?
Note: You are not allowed to use any software for the calculation. But for the preparation of Decision tree diagram you are advised to use Software like MS -Word, PowerPoint etc.
Solution:
Tree Diagram:
A tree diagram is a graphical representation of a decision-making process, often used in probability and decision analysis to visualize and analyze a sequence of events, choices, and outcomes. It is particularly useful for complex decision problems that involve uncertainty and multiple possible scenarios. Tree diagrams are employed in various fields, including finance, project management, and engineering, to help individuals or organizations make informed decisions. Here’s a detailed explanation of a tree diagram:
Components of a Tree Diagram:
- Node: A node in a tree diagram represents a point in the decision-making process. There are two main types of nodes:
- Decision Node: A square or rectangular node where a decision needs to be made. This is where you choose between various options or courses of action.
- Chance Node: A circular node where uncertain events or scenarios are represented. At chance nodes, probabilities are assigned to different outcomes.
- Branches: Branches connect nodes and represent the possible outcomes or choices. Each branch is labeled with the probability or the value associated with that branch.
- Outcomes: Outcomes are the results or consequences of a specific choice or event. They are often associated with chance nodes and can have values or probabilities assigned to them.
Creating and Analyzing a Tree Diagram:
- Identify the Decision Problem: Clearly define the decision problem and break it down into a series of decision points and uncertain events. These decision points and events become the nodes in the tree diagram.
- Assign Probabilities and Values: For each chance node, assign probabilities to the different outcomes or scenarios. For decision nodes, consider the available choices and options.
- Calculate Expected Monetary Value (EMV): The EMV is a critical concept associated with tree diagrams. It represents the expected financial value of a decision at a specific node, considering the probabilities and values associated with various outcomes. The EMV is calculated by multiplying the probability of each outcome by its associated value and summing these values.
- Analyze the Tree: Follow the branches from left to right, considering the probabilities and values as you move through the decision tree. Calculate the EMV at each decision node to determine the best course of action.
- Make Decisions: The tree diagram provides a visual representation of the decision problem and helps you identify the option with the highest EMV, which is often the recommended decision.
Applications of Tree Diagrams:
- Project Management: Tree diagrams can help project managers assess risks and make project-related decisions by considering various scenarios.
- Financial Decision-Making: In finance, tree diagrams are used to evaluate investment decisions, assess portfolio risks, and analyze financial options.
- Supply Chain Management: Tree diagrams can help optimize supply chain decisions by considering factors such as demand uncertainty, lead times, and transportation options.
- Healthcare Decision Analysis: Healthcare professionals can use tree diagrams to assess treatment options and their associated risks and benefits.
Expected Monetary Value (EMV):
Expected Monetary Value (EMV) is a concept often associated with tree diagrams and decision analysis. It represents the anticipated financial outcome of a decision or action, considering the probabilities of different scenarios. The EMV helps decision-makers compare various options and choose the one with the highest expected financial value.
The formula for calculating EMV i.e. EMV=∑(Pi×Vi)
Where:
- EMV is the Expected Monetary Value.
- Pi represents the probability of scenario i.
- Vi represents the monetary value associated with scenario i
EMV is a valuable tool for quantifying the potential value or cost of a decision, particularly in situations where multiple scenarios and uncertainties are involved. It allows decision-makers to make more informed choices by considering both the likelihood and magnitude of different outcomes.
Decision Tree Diagram for Mr. Saproo’s Investment
Decision: Which investment option should Mr. Saproo choose?
Chance: What will be the economic growth in the coming year?
Outcomes: Good Economic Growth, Moderate Economic Growth, Lower Economic Growth
Payoffs:
| Option | Good Economic Growth | Moderate Economic Growth | Lower Economic Growth |
|---|---|---|---|
| Maruti Suzuki Shares | 3,00,000 | 1,20,000 | 50,000 |
| Tata Motor Shares | 4,00,000 | 1,00,000 | 10,000 |
| D Mart Shares | 4,50,000 | 2,30,000 | 30,000 |
drive_spreadsheetExport to Sheets
Decision Tree Diagram:
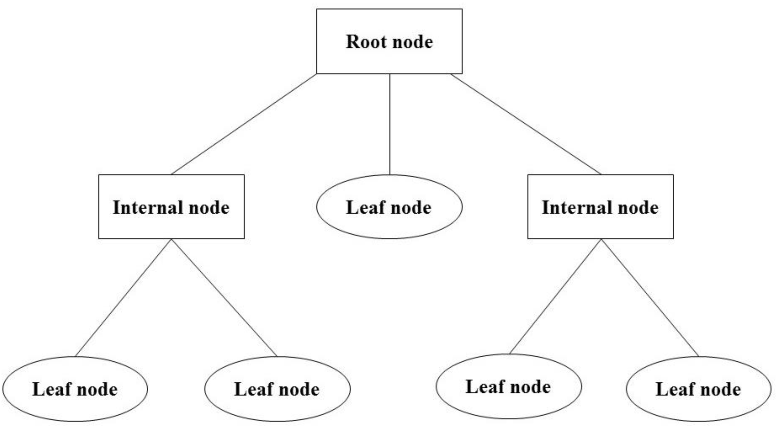
In the decision tree diagram for Mr. Saproo’s investment, the root node is the decision node that represents the decision that Mr. Saproo needs to make: which investment option to choose?
The internal nodes are the chance nodes that represent the different possible outcomes of the economic growth in the coming year: Good Economic Growth, Moderate Economic Growth, and Lower Economic Growth.
The branches are the lines that connect the nodes and represent the different paths that the decision tree can take. Each branch represents a different combination of decisions and outcomes.
For example, the branch that starts at the root node and ends at the leaf node labeled “D Mart Shares, Good Economic Growth” represents the path that Mr. Saproo would take if he chooses to invest in D Mart Shares and the economic growth in the coming year is Good.
The following table shows the different types of nodes and branches in the decision tree diagram and their corresponding meanings:
| Node Type | Meaning |
|---|---|
| Root node | The decision that Mr. Saproo needs to make: which investment option to choose? |
| Internal node | A chance node that represents a possible outcome of the economic growth in the coming year. |
| Leaf node | A node that represents the final outcome of a decision path. |
| Branch | A line that connects two nodes and represents a possible path that the decision tree can take. |
- Root node: Which investment option should Mr. Saproo choose?
- Internal nodes:
- Economic growth in the coming year: Good, Moderate, Lower
- Leaf nodes:
- Maruti Suzuki Shares: 3,00,000, 1,20,000, 50,000
- Tata Motor Shares: 4,00,000, 1,00,000, 10,000
- D Mart Shares: 4,50,000, 2,30,000, 30,000
- Branches:
- Connecting the root node to the internal nodes
- Connecting the internal nodes to the leaf nodes
The arrows on the branches indicate the direction of the decision tree. For example, the arrow pointing from the root node to the internal node labeled “Good Economic Growth” indicates that if Mr. Saproo chooses to invest in Maruti Suzuki Shares, the next decision that the decision tree will make is whether the economic growth in the coming year will be Good.
- Decision: Which investment option should Mr. Saproo choose?
- Chance: What will be the economic growth in the coming year?
- Outcomes: Good Economic Growth, Moderate Economic Growth, Lower Economic Growth
- Payoffs:
- Maruti Suzuki Shares: 3,00,000, 1,20,000, 50,000
- Tata Motor Shares: 4,00,000, 1,00,000, 10,000
- D Mart Shares: 4,50,000, 2,30,000, 30,000
Expected Monetary Value (EMV)
To calculate the EMV for each investment option, we need to weigh the payoffs for each outcome by the probability of that outcome occurring.
EMV for Maruti Suzuki Shares:
(3,00,000 * 0.1) + (1,20,000 * 0.5) + (50,000 * 0.4) = 1,80,000
EMV for Tata Motor Shares:
(4,00,000 * 0.1) + (1,00,000 * 0.5) + (10,000 * 0.4) = 1,50,000
EMV for D Mart Shares:
(4,50,000 * 0.1) + (2,30,000 * 0.5) + (30,000 * 0.4) = 2,15,000
Recommendation
Based on the EMVs calculated above, the best investment option for Mr. Saproo is D Mart Shares. It has the highest EMV of 2,15,000, which means that it is the investment option that is most likely to yield the highest return.
It is important to note that this is just a recommendation based on the information provided in the question. Mr. Saproo should always do his own research and consult with a financial advisor before making any investment decisions.
Note: The above solution is for reference purposes of the students and teachers only and not for commercial usage please.