
Q1. “Demand forecasting plays a vital role and enables organisations to arrange for the required input as per the predicted demand, without any wastage of material and time” Substantiate your view on demand forecasting and discuss the various factors influencing demand forecasting. (10 Marks)
Demand forecasting is a critical process for organizations across various industries, as it allows them to anticipate future customer demand for their products or services. It plays a vital role in helping organizations optimize their operations, inventory management, and overall business strategy. Here’s a discussion of the importance of demand forecasting and the factors influencing it:
Importance of Demand Forecasting:
- Efficient Resource Allocation: Demand forecasting helps organizations allocate resources like raw materials, labor, and production capacity more efficiently. It ensures that they have the right amount of inputs to meet customer demand without overstocking or understocking.
- Inventory Management: Accurate demand forecasts help in maintaining optimal inventory levels. This prevents excessive carrying costs associated with overstocking and avoids stockouts that can lead to customer dissatisfaction.
- Cost Reduction: Effective demand forecasting can lead to cost reductions by minimizing wastage and storage expenses, as well as by avoiding rush orders and production disruptions due to unexpected surges in demand.
- Strategic Planning: Demand forecasts provide valuable insights for long-term strategic planning. They guide product development, marketing strategies, and expansion plans by indicating market trends and potential opportunities.
- Customer Satisfaction: By consistently meeting customer demand, organizations can improve customer satisfaction and loyalty, ultimately leading to increased sales and market share.
Factors Influencing Demand Forecasting:
- Historical Data: Past sales data and customer behavior patterns are crucial for making forecasts. Historical sales data provide insights into seasonality, trends, and cyclicality.
- Market Research: Qualitative data from market research, customer surveys, and expert opinions can supplement quantitative data and provide a more comprehensive view of future demand.
- Economic Factors: Macroeconomic factors such as GDP growth, inflation rates, and consumer confidence levels can influence demand. A strong economy often leads to higher demand.
- Competitive Landscape: The actions and strategies of competitors can impact demand. The introduction of new products or aggressive marketing campaigns by competitors may affect market dynamics.
- Seasonality and Trends: Seasonal variations and long-term trends in demand must be considered. For example, the demand for winter clothing and accessories will naturally peak during the colder months.
- External Events: Events like natural disasters, political changes, and public health crises (e.g., COVID-19) can disrupt supply chains and significantly affect demand.
- Technological Advancements: Advances in technology can lead to changes in consumer preferences and behaviors, influencing demand for products and services.
- Government Regulations: Regulatory changes, such as tariffs, environmental regulations, or safety standards, can impact production and demand for certain goods.
- Promotions and Marketing Efforts: The effectiveness of promotional campaigns and marketing efforts can affect short-term demand variations.
- Consumer Behavior: Understanding consumer behavior, including buying patterns and demographics, is crucial in forecasting demand accurately.
In conclusion, demand forecasting is essential for efficient resource management, cost reduction, and strategic planning. Various factors, including historical data, market research, economic conditions, competition, and consumer behavior, influence the accuracy of demand forecasts. To make informed decisions, organizations must consider all these factors when conducting demand forecasting, leading to better business outcomes.
Q2. Define the term “Elasticity of demand.” Discuss different types of elasticity of demand. Also, explain why this concept should be of interest to anyone in business who has a choice to determine the price at which to sell their products. (10 Marks)
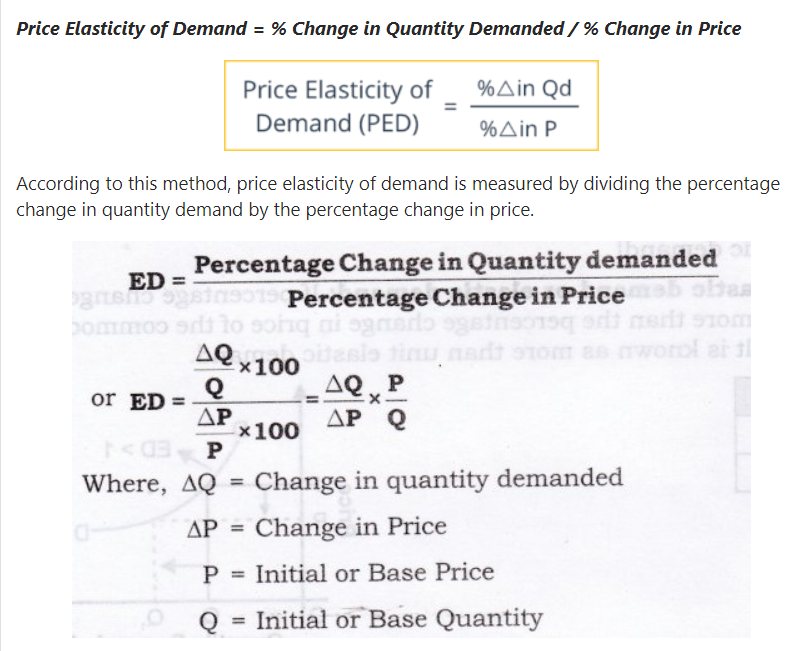
Elasticity of demand is a fundamental concept in economics that measures the responsiveness of the quantity demanded of a product to changes in its price. It indicates how sensitive consumer demand is to price fluctuations. The formula for calculating the price elasticity of demand (PED) is:
Different Types of Elasticity of Demand:
- Perfectly Elastic Demand (PED = ∞): In this scenario, even a slight change in price leads to an infinite change in the quantity demanded. Consumers are so sensitive to price changes that they will only buy the product at a specific price. Perfectly elastic demand is theoretical and rarely exists in the real world.
- Perfectly Inelastic Demand (PED = 0): Here, quantity demanded remains constant regardless of price changes. Consumers consider the product a necessity and are not responsive to price fluctuations. Examples include life-saving medications or critical utilities.
- Unitary Elastic Demand (PED = 1): In this case, the percentage change in quantity demanded is equal to the percentage change in price. Total expenditure remains constant as price changes. Unitary elasticity is relatively rare.
- Elastic Demand (PED > 1): Elastic demand occurs when the percentage change in quantity demanded is greater than the percentage change in price. Consumers are responsive to price changes, and a price increase leads to a proportionally larger decrease in quantity demanded. This is common for non-essential or luxury goods.
- Inelastic Demand (PED < 1): Inelastic demand means that the percentage change in quantity demanded is less than the percentage change in price. Consumers are less sensitive to price changes, and a price increase results in a proportionally smaller decrease in quantity demanded. This is typical for essential goods like food and utilities.
Why Elasticity of Demand is of Interest to Businesses:
The concept of elasticity of demand is of paramount importance to anyone in business who has the flexibility to set prices for their products for several reasons:
- Pricing Strategy: Understanding the price elasticity of demand helps businesses set optimal prices. For products with elastic demand, lowering prices can lead to higher total revenue, while for inelastic products, price increases may be possible without significant reductions in demand.
- Revenue Optimization: By identifying the elasticity of demand for their products, businesses can maximize total revenue. They can adjust prices to find the price point that generates the most profit.
- Product Planning: Businesses can use elasticity information to plan product lines and diversify their offerings. Products with varying elasticities can help balance risk and revenue.
- Competitive Advantage: Knowledge of elasticity can give businesses a competitive edge by allowing them to react more effectively to market changes and competitor pricing strategies.
- Cost Management: Understanding elasticity can guide decisions on cost control and production levels. For elastic products, reducing production costs is critical to maintaining profitability.
- Market Expansion: Knowledge of elasticity can inform market expansion decisions. If a product is inelastic, businesses may have the opportunity to explore new markets without a substantial risk of price-based competition.
In conclusion, the elasticity of demand is a crucial concept for businesses, as it guides pricing strategies, revenue optimization, product planning, and overall decision-making. It empowers businesses to make informed choices about how to price their products in a competitive marketplace.
Q3 A) “The root of the economic problem is the scarcity of resources while our wants are infinite”. Elaborate the given statement explaining the three types of economic problems faced by an economy in achieving in production and distribution. (5 Marks)
The statement “The root of the economic problem is the scarcity of resources while our wants are infinite” encapsulates a fundamental concept in economics. It highlights the central challenge that all economies face, which is the inherent scarcity of resources in the face of unlimited human wants. This scarcity gives rise to three types of economic problems in the production and distribution of goods and services:
- What to Produce (Allocation Problem):
- In any economy, resources are limited, and there are various goods and services that people desire. The first economic problem is deciding what to produce given these constraints.
- This allocation problem involves determining which goods and services will be produced, in what quantities, and for whom. It requires making choices about resource allocation to meet society’s diverse needs and preferences.
- How to Produce (Efficiency Problem):
- Once the decision about what to produce is made, the economy faces the question of how to produce those goods and services efficiently.
- This efficiency problem involves selecting the best methods and techniques for production. It includes decisions about the allocation of labor, capital, and technology to produce goods and services in a cost-effective manner, minimizing waste and maximizing output.
- For Whom to Produce (Distribution Problem):
- Even after determining what to produce and how to produce it, there is the issue of who gets to consume these goods and services.
- The distribution problem pertains to the allocation of the produced goods and services among the members of society. It involves issues of income distribution and ensuring that the benefits of production are distributed fairly, taking into account varying levels of wealth and income.
These three economic problems are interconnected and form the basis of economic decision-making in any society. The allocation problem addresses what the economy should focus on, the efficiency problem deals with how to produce efficiently, and the distribution problem centers on the equitable sharing of the resulting output.
Economies must make choices and trade-offs in addressing these problems due to resource scarcity. These choices have significant implications for a society’s standard of living, the allocation of wealth and income, and the overall well-being of its citizens. Economists study these problems and seek to find ways to optimize resource allocation, production methods, and distribution mechanisms to improve overall economic welfare and address the challenges posed by scarcity and unlimited human wants.
Q3b) Complete the hypothetical table – compute and show steps on Average Product and Marginal product. (5 Marks)
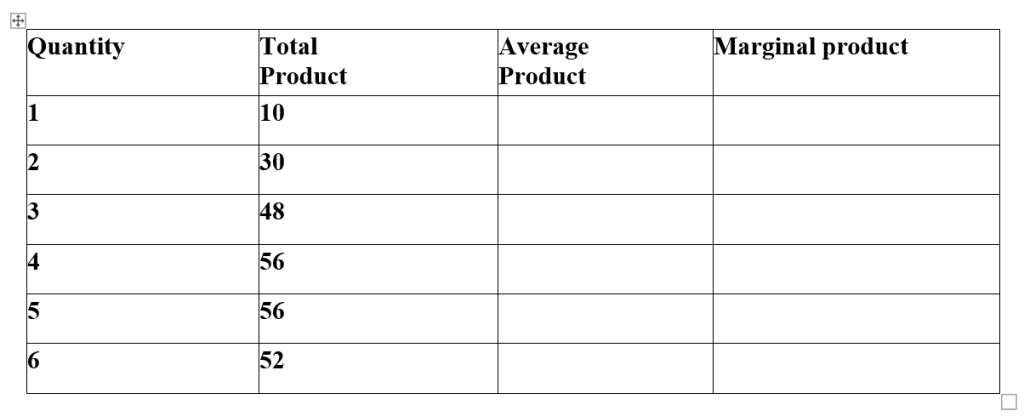
To complete the table and calculate the Average Product (AP) and Marginal Product (MP), you can follow these steps:
- Quantity of Labor (L): This is the number of workers or units of labor input.
- Total Product (TP): Total product represents the total output or production achieved with a given quantity of labor.
- Average Product (AP): Average product is calculated by dividing the total product (TP) by the quantity of labor (L). It measures the average output produced by each unit of labor.
- Marginal Product (MP): Marginal product is the additional output produced when one more unit of labor is employed while holding all other factors constant. It is calculated by finding the change in total product when one more unit of labor is added.
Let’s complete the table:
| Quantity (L) | Total Product (TP) | Average Product (AP) | Marginal Product (MP) |
|---|---|---|---|
| 1 | 10 | 10 | |
| 2 | 30 | 15 | |
| 3 | 48 | 16 | |
| 4 | 56 | 14 | |
| 5 | 56 | 11.2 | |
| 6 | 52 | 8.67 |
Now, let’s calculate the missing values for Marginal Product (MP):
- MP (2) = TP (2) – TP (1) = 30 – 10 = 20
- MP (3) = TP (3) – TP (2) = 48 – 30 = 18
- MP (4) = TP (4) – TP (3) = 56 – 48 = 8
- MP (5) = TP (5) – TP (4) = 56 – 56 = 0
- MP (6) = TP (6) – TP (5) = 52 – 56 = -4
Now the table is complete:
| Quantity (L) | Total Product (TP) | Average Product (AP) | Marginal Product (MP) |
|---|---|---|---|
| 1 | 10 | 10 | |
| 2 | 30 | 15 | 20 |
| 3 | 48 | 16 | 18 |
| 4 | 56 | 14 | 8 |
| 5 | 56 | 11.2 | 0 |
| 6 | 52 | 8.67 | -4 |
These values show how the total, average, and marginal product change as you increase the quantity of labor input.
The solution hints presented here is for reference purpose only. Do not copy